
Rising Wedge Chart Pattern
The rising wedge is a technical chart pattern used to identify possible trend reversals. A rising wedge chart pattern is formed by two converging trend lines when the stock's prices have been rising for a…
Learn How To Invest


The rising wedge is a technical chart pattern used to identify possible trend reversals. A rising wedge chart pattern is formed by two converging trend lines when the stock's prices have been rising for a…
The Double Bottom is a bullish reversal pattern that is formed after the downtrend. Double bottom chart pattern occurs at the bottom of a downtrend. The double bottom pattern is also known as the W…
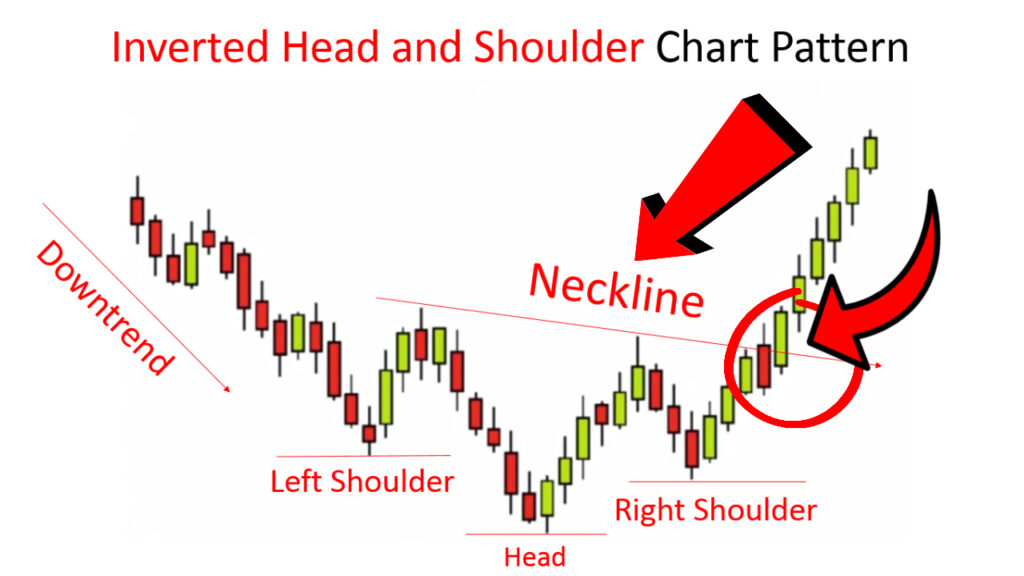
The Inverted Head and Shoulder Chart Pattern occurs during a downtrend and marks its end. This is a bearish reversal pattern. It usually occurs after an extended move higher and represents exhaustion from buyers. With…
The Head and Shoulder Chart Pattern is a price reversal pattern that helps traders identify when a reversal may come in the market. Whenever you see the head and shoulders pattern in the market. At…

The Bearish Engulfing Candlestick Pattern is considered to be a bearish reversal pattern, usually occurring at the top of an uptrend. Bearish Engulfing Candlestick Pattern Bearish Engulfing Candlestick Pattern You will see this pattern forming…

A bullish engulfing pattern candlestick pattern is forms when a small red candlestick is followed the next day by a large green candlestick, the body of which completely overlaps or engulfs the body of the…

The dark cloud cover candlestick pattern is a bearish reversal signal. Whose presence indicates a probable reversal to a downward trend. The Dark Cloud Cover pattern is a candlestick pattern that signals a potential reversal…

Piercing line candlestick pattern formed near the support levels and it gives us potential bullish reversal signs. The piercing line pattern consists of two candlesticks, which suggests a potential bullish reversal. It is a two-day…

A hanging man candlestick pattern is a bearish candlestick pattern that forms at the end of an uptrend. It has a long lower wick and a short body at the top of the candlestick with…

A hammer is a type of bullish reversal candlestick pattern. Hammer candlesticks typically occur after a price decline. They have a small real body and a long lower shadow. The lower shadow should be at…
Copyright - Best Analysis | Design & develop by AmpleThemes